Since the COVID-19 pandemic, a striking divergence has emerged in the UK. While pensioners are living longer, working-age adults are facing worsening mortality rates. Our analysis considers trends in leading causes of death at working ages and provides insight on drivers behind the trends in these causes.
Introduction
Overall age-standardised mortality rates (ASMRs1) improved in 2022-2024, however the overall picture is skewed by higher improvements at older, pensioner ages [1]. ASMRs for ages 20-44 in 2022-2024 were higher than the 2014-2023 average. This is also broadly true for ages 45-64, except that improvements were observed in 2024, albeit at low levels for males.
This is a public health concern and has implications for society and policymakers, as well as life insurers and reinsurers involved with pricing and reserving.
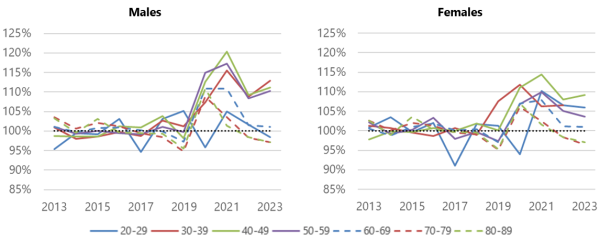
Figure 1 shows the ratio of all-cause mortality (ASMRs) by calendar year to the 2013-2019 average for 10-year age bands. This highlights the difference in mortality trends, particularly following the pandemic, between working ages (which generally remain elevated) and older ages (which return to average levels).
Figure 1: All-cause mortality relative to the 2013-2019 average
Source: Office for National Statistics
Trends by cause of death
We have considered trends for the leading causes of death and show some of these below. Less prevalent causes have also contributed to the worsening of mortality, the two main causes being mental and behavioural disorders, and endocrine, nutritional and metabolic diseases.
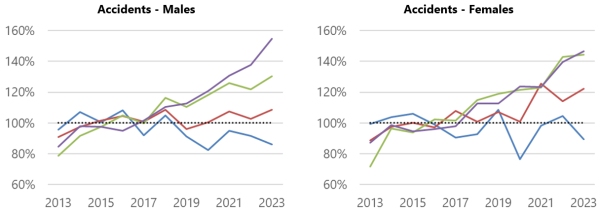
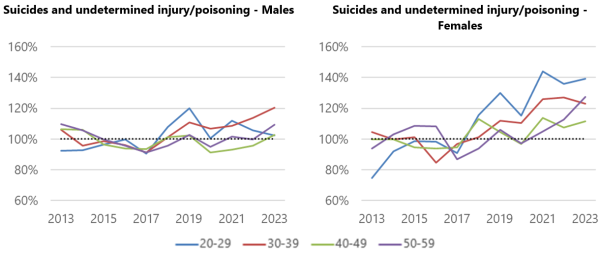
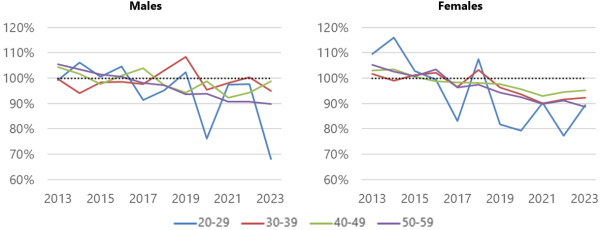
The format of Figures 2 to 4 is consistent with Figure 1, showing mortality relative to the 2013-2019 average for each cause. We note that external causes dominate deaths for younger adults, particularly males, while cancer and circulatory diseases are more prominent in older working-age groups.
External causes
The top external causes of death are accidents (e.g. drug/alcohol poisoning, falls, traffic incidents), and suicides and undetermined poisonings. Together these account for 90%-95% of all mortality from external causes (around 40% “suicides” and 50% accidents). At an overall level, male and female rates generally increase over the whole 2013-2023 period, with a sharp rise in 2023 for some age bands. Figure 2 shows that the trend varies for each sub-cause.
- Accidental deaths: For both males and females, there are marked increases at ages 40-59 from around 2018. Our analysis shows that accidental poisonings by narcotics and hallucinogens and accidental poisonings by unspecified drugs are both (a) the leading type of accidental death and (b) driving the trend to heavier mortality rates.
- Suicides and injury/poisoning from undetermined events: The trends are more varied. There are substantial increases in female mortality for most age bands. For males, only ages 30-39 show evidence of an increasing trend.
Figure 2: External causes mortality relative to the 2013-2019 average
Source: Office for National Statistics
Cancer
Male rates steadily decline over the period for ages 40-49 and 50-59 but trends are less clear for the 20-29 as deaths are volatile. Female rates steadily decrease, similar to males, with some evidence that improvements have stalled since 2021 for the three older age bands.
Figure 3: Cancer mortality relative to the 2013-2019 average
Source: Office for National Statistics
Circulatory
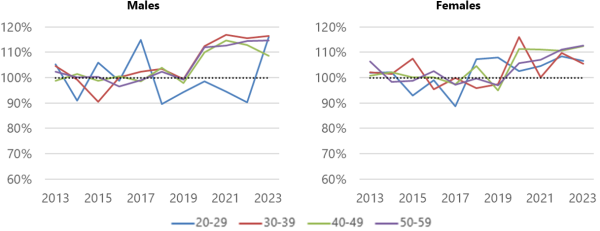
There is a step-change in level of rates between 2019 and 2020, which persists for the remainder of the period for some older age bands. For males 50-59, mortality from circulatory diseases becomes the leading cause in 2023 (overtaking cancer).
Mortality arising from diseases of the digestive system also shows a similar pattern by year, i.e. step-change in 2020 which persists until the end of the period.
Figure 4: Diseases of the circulatory system mortality relative to the 2013-2019 average
Source: Office for National Statistics
Summary of trends in causes of death
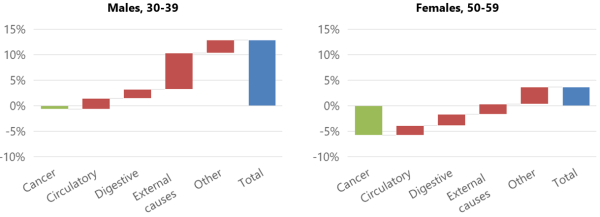
Figure 5 shows the attribution of each cause to the change in all-cause mortality between the 2013-2019 average and 2023 for males aged 30-39 and females aged 50-59. This provides useful context to the trends noted in the previous section, and highlights differences in how the composition of causes of death is evolving. The direction of change for each cause is the consistent in both charts, however the size of the change, and therefore the overall impact, varies considerably by sex and age band:
- Males 30-39 shows that the majority of the increase in mortality was driven by external causes, and cancer had little mitigating impact.
- Females 50-59 shows that the decrease in mortality from cancer had the single biggest impact while the increase from external causes only had a small impact.
Figure 5: Attribution of each cause to the change in “all cause” mortality between the 2013-2019 average and 2023
Source: Office for National Statistics
What are the drivers of worsening working-age mortality in the UK?
Understanding the drivers behind trends in causes of death gives an indication of how the level of mortality is likely to develop in the short and medium term. Life insurers will be taking a keen interest in these trends and the drivers behind them, as these could impact the pricing of products.
Deaths of despair
Two leading external causes of death are accidental and intentional deaths from drugs and alcohol, which have collectively been coined “deaths of despair”.
There are a number of drivers impacting deaths of despair, such as the proliferation of recreational drug taking, drug and alcohol addiction, mental health and the cost of living. Survival rates will be linked to ambulance response times, which were considerably elevated between summer 2021 and early 2023 [2] and have remained elevated since then but to a lesser extent. It is difficult to say whether these factors will manifest a trend that varies over time or by age cohort (or both).
The COVID-19 pandemic’s lingering shadow
COVID-19 had little impact on the overall mortality rates outside of 2020-2021 and no bearing on trends before 2020. However, we cannot ignore it.
- Lockdowns affected the ability for all ages to live normal lives, impacting socialisation, recreation, travelling, employment and delayed diagnoses of serious illnesses.
- The cost of living also increased significantly.
- Thousands of people contracted Long Covid. Analysis of over 750,000 people [3] showed 4.8% of respondents reported having Long Covid, and 9.1% were unsure. Other morbidities are likely to have arisen as a result of contracting COVID-19, with likely links to mortality from circulatory and digestive diseases.
- On the other hand, people with respiratory diseases are likely to have been worse affected by COVID-19, possibly creating survivorship bias leading to fewer respiratory deaths in 2021-2022. Our analysis shows that several working-age bands show light respiratory mortality in 2021 and 2022, followed by heavier than average mortality for males and close-to-average mortality for females in 2023.
It is reasonable to suspect that the effects of the pandemic will weaken over time, however particular cohorts could see longer lasting impacts.
The growing burden of lifestyle and chronic diseases
Circulatory, digestive and respiratory deaths are more likely to be as a result of chronic illnesses.
- There are known links between obesity, chronic diseases and heavier mortality from related causes. OHID analysis shows that the proportion of obese adults has increased (29% in 2022 compared with 25% in 2013) [4].
- There is growing evidence that ultra-processed foods impact chronic diseases. Survey data shows that fewer adults are eating at least five portions of fruit and vegetables a day (31% in 2023/24 compared with 35% in 2020/21) [4].
However, Semaglutide and similar medications have gained popularity, with medications now available to some on prescription for the expressed reason of weight loss and to combat a variety of diseases and symptoms. The spread of such drugs could go some way towards slowing or reversing current trends.
What next?
The release of 2024 cause of death data will bring further insight. Specifically, 2024 was the first year of improvements since the pandemic for ages 45-64. For insurers and reinsurers, the challenge is two-fold: Are these trends temporary or cohort-specific, and how do the trends for insured lives compare with the general population (such as the data we have described above)?
James Hadley is a Senior Consultant at Barnett Waddingham
Footnotes:
Any views expressed in this article are those of the author(s) and may not necessarily represent those of Life Risk News or its publisher, the European Life Settlement Association

