My previous article looking at the American Council of Life Insurers’ (ACLI) 2024 Life Insurers Fact Book ACLI showed an industry in good health from a balance sheet perspective. New annuity business continued to dominate with strong growth although, for life insurance, the picture was a little more mixed.
The third of our reviews of the Life Insurers Fact Book 2024 focusses on how factors that could impact the life settlement market are developing. Key amongst these are the surrender volumes, which help indicate the volumes of policies that could be available to trade, and the rate of new life insurance business which will provide the fuel for the market in future.
The ACLI data are all retrospective and the latest set refers to the year 2023 which, by now, is already just over a year old compared to market participants’ current experience, and it is information of a low granularity, so one needs to be aware that there are some generalisations being used to imply trends. The types of policy most commonly traded in the life settlement secondary market are only a sub-set of the whole range of life insurance products issued, so a trend in total business may not perfectly reflect the trend in tradeable products alone.
Policy Cancellations
Policy exits will come about as death or maturity claims and, possibly most commonly, through lapse (with no value) or surrender (if there is an intrinsic value) although the two may be aggregated in some statistics. The ACLI provide cancellation rates split by surrender and lapse and split the figures between individual and group policies. This article will focus on individual policies, but there is no further granularity between product types.
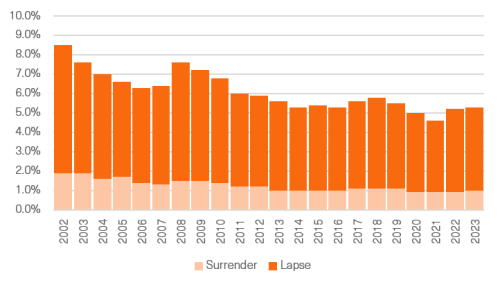
Figure 1: Individual Policy Cancellations by Face Amount
Source: ACLI Life Insurer’s Fact Book, 2024 Edition
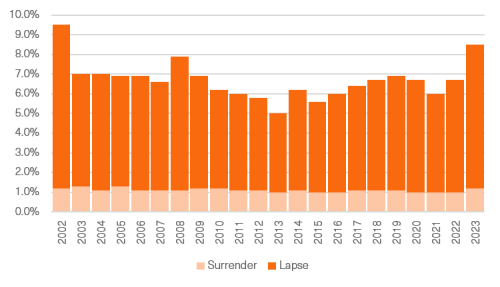
Figure 2: Individual Policy Cancellations by Number
Source: ACLI Life Insurer’s Fact Book, 2024 Edition
The year 2023 saw an uptick in both lapse and surrender rates and given the stress on household finances, particularly at the lower end of the income spectrum, that is perhaps unsurprising.
Figures 1 and 2 above both show a rise in all cancellations. However, the latter chart, using just policy numbers shows a much more pronounced rise compared to the chart showing cancellations by volume. This clearly demonstrates that smaller policies were the ones being jettisoned; reasons for this could be either lower income households electing to abandon their cover, perhaps with a view to joining an employer scheme, or higher income households merely cancelling smaller policies and retaining larger ones, or both.
By number, the effect is quite dramatic and means that the 2023 rate of cancellations was the highest in 20 years. The rise in surrender values paid out was notably large with surrender payments rising from $28.8bn to $35.8bn (+24.1%). These figures suggest that there has been reward for those providers within the life settlement market tapping the smaller policy segment of the market.
These cancellation rates do come with a caveat. They cover all individual policies, not just whole of life policies, which are those most frequently traded in the marketplace. But they also cover term policies, which most frequently are those which lapse with zero value, whereas those surrendered for value are those from the whole life (or comparatively smaller endowment) policy population. Whereas the lapse rate by policy number rose from 5.7% in 2022 to 7.3% in 2023 (a rise of 28%) the surrender rate only rose from 1.0% to 1.2% (a rise of 20%). Whilst the surrender rate was lower, it was by no means insignificant for the life settlement market.
By volume, the changes in these rates were 4.3% to 4.3% for lapses (which after rounding is no change) and for surrenders, 0.9% to 1.0%. It would also appear that amongst policies surrendered for value, this was not motivated primarily by people seeking to realise capital, but instead by the aim to trim outgoings. We don’t have the granularity of data to find further evidence to draw firm conclusions as to which sections of the population engaged in this, but one can speculate that it is a combination of harder hit families, those in middle age, and/or the very elderly, who would have been faced with rapidly escalating cost of insurance. The latter will be of greatest interest to the life settlement market.
New Policy Sales and In Force
While those policyholders seeking to cease maintaining their policies is of immediate interest to the life settlement market, and clearly the fuel for today’s activity, tomorrow’s fuel is the in-force book, and the day after tomorrow’s fuel is the new business being put on the books.
Last month, we compared the growth in in-force life policy reserves with general US gross domestic product (GDP) and saw that in the last two or three years, it has slightly decoupled. Whether that fall away was down to decreasing new business not fully replacing policy cancellations and maturities or that recent years’ GDP figures have been temporarily boosted by government stimuli that has not fully trickled down to the wider population (e.g., the various green project subsidies), is a moot point.
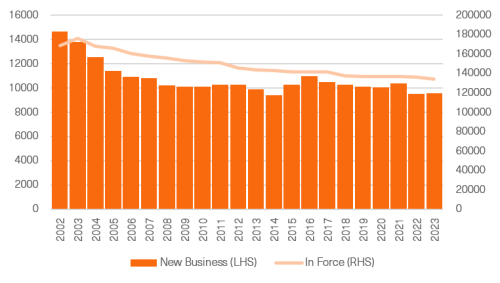
What we can see from Figure 3 below is that by policy numbers, there is a tail off, notably in 2022 and again in 2023.
Figure 3: Individual Policies – Numbers (000’s)
Source: ACLI Life Insurer’s Fact Book, 2024 Edition
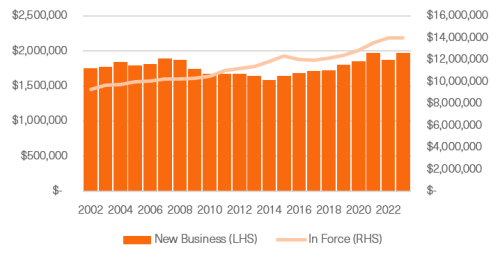
Measured by face amount, however, the picture is still a rising one, as can be seen in Figure 4 below.
Figure 4: Individual Policies, Aggregate Face Amount ($000,000’s)
Source: ACLI Life Insurer’s Fact Book, 2024 Edition
Taken together, these paint a picture of slower new policy sales by policy number, but a small rise by volume or face amount. For the built up book of in force, the numbers of policies continue a slow, but long-standing decline, but by absolute face amount, it continues to hold up.
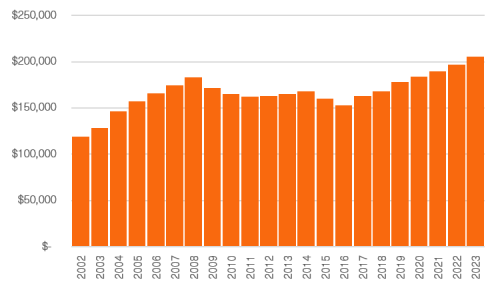
The divergence between new business by policy number and by face amount is further illustrated by rising average face amount in Figure 5 below.
Figure 5: New Business, Average Face Amount ($000’s)
Source: ACLI Life Insurer’s Fact Book, 2024 Edition
This chart shows quite a significant rise in average face amount. In 2023, this was $206,000, compared to $197,000 in 2022, a rise of 4.6%. This is lower than the peak rate of consumer price index inflation in the US at 9.1% in June 2022 but was higher than every month in 2023 from May onwards. Price inflation might help explain household financial stress, but it is not likely to be the most important driver here. Affordability from wage increases will be important and the average pay rise index in the US peaked at 5.9% in March 2022 and was hovering around the 4% mark during 2023. Other factors such as outstanding house purchase loans or any other liabilities related to earnings are also likely to be drivers.
Overall, the conclusions to draw here are that, at present, we are in a cycle where the levels of life insurance coverage are still declining. This may not be in absolute terms, but in real terms. The average policy size is increasing albeit that the average real terms policy size in 2008 was still higher than now. Nevertheless, any decline is very gradual and could easily reverse.
Whole of Life and Endowments Specifically
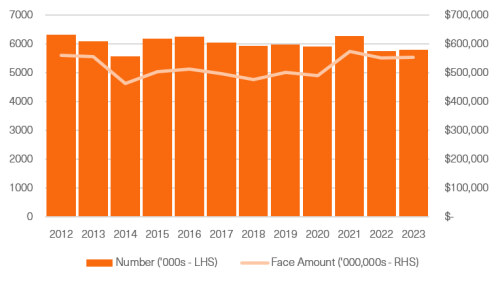
The aggregates for individual policies include all business including term policies of differing types. These polices make up roughly half of the total new business and typically carry larger face amounts than whole of life or endowment policies. The data available aggregate WOL and Endowment although sales of the latter are a relatively small proportion.
Figure 6: Individual Whole of Like and Endowments – New Business
Source: ACLI Life Insurer’s Fact Book, 2024 Edition
We are only able to show data back to 2012 for this specific subset of all life policies, but the picture continues to mirror life policies as a whole with marginally lower numbers of new policies sold in 2023 than 2021 but marginally higher new policy sales compared to 2022 (5,797,000 compared to 5,766,000). For this group. the levels of new face amount per policy remain similar year on year.
Summary
If elevated policy cancellation rates in 2022 suggested some financial stress amongst households, 2023 implied continued stress, although this may have been due to people taking corrective action in arrears rather than immediately when their problems struck. For that reason, it is hard to draw any conclusion of permanence, and it is reasonable to suggest that we should be expecting a drop off in cancellation rates in the near future. The disparity between the rise in cancellation rates by number and by volume clearly shows that smaller policies are the ones being cancelled and those market participants in that section of the market will be benefitting.
New business levels are lower than historically and there is no immediate sign of a reversal, but at the same time, as with last year, it is reasonable to say that new business levels remain significant, which should lead to a healthy supply of paper for the life settlement secondary market for some considerable time to come, all other things being equal.
Roger Lawrence is Managing Director at WL Consulting
Any views expressed in this article are those of the author(s) and may not necessarily represent those of Life Risk News or its publisher, the European Life Settlement Association

